http://www.westbatonrougeappraiser.com/ – West Baton Rouge Parish Foreclosure Trends: 2009 2010 Foreclosure Sales Numbers! 2010 Foreclosures total 7% of sales YTD; 2009 Foreclosures totaled 5%, an increase of +2% since 2009. 4% of all MLS Listings are Foreclosures! Foreclosures are only moderately impacting this market. There’s A Major “Caveat” with the numbers below!

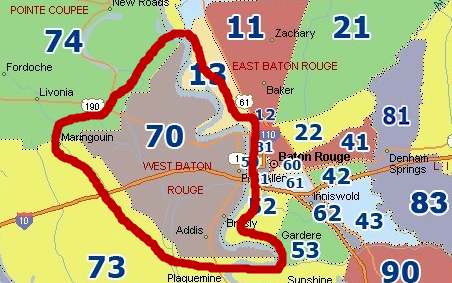
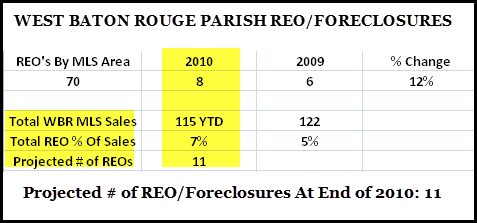
The chart below represents the number of recorded West Baton Rouge Parish REO or Foreclosure Sales within the Greater Baton Rouge MLS as of 10/16/2010, with the exception of Manufactured Housing sales. The GBRMLS Areas for West Baton Rouge Parish is 70.

Let’s put these foreclosure numbers into perspective! In 2009, there were a total of 122 sales. 6 foreclosure sales in 2009 represents only 5% of total sales. In 2010, there have been a total of 115 sales. 8 foreclosure sales in 2010 as of 10/16/2010 represents only 7% of total sales. The projected number of reo / fore closures at end of 2010 is approximately 11.
There’s A Major “Caveat” with the numbers below! Based on a 7% REO sold rate, which does appear to be an indication REOs are only moderately negatively impacting this market. It’s also stated here that an article (The Landmines Within by Michael Tarabotto http://activerain.com/blogsview/930436/The-Landmines-Within ) stated that as much as 70% of REOs never make it into the MLS – Meaning that it might be impossible to know or state the exact # of competing REOs if they’re not being listed and that the foreclosure problem could be larger if up to 70% of REOs aren’t being listed. MLS is reporting 4 current REO listings for all West Baton Rouge MLS Area 70 out of a total 114 total listings. So, 4% of all West Baton Rouge MLS Listings are Foreclosures!
REO is “Real Estate Owned”!

Data used with permission of the GBRMLS. Search dates are 1/1/2009 to 10/16/2010. Extraction date was 10/16/2010.
